Ultra detailed modified plastic composition analysis guide, in addition to burning teeth bite can also be——
 Date:2022-05-25
 Views:1293
The structure of polymer materials determines their properties. Polymer materials with different characteristics can be obtained by controlling and modifying the structure. In order to understand the composition of purchased raw materials or reverse the formula of market materials, the R & D laboratories of many modification factories need to analyze the composition of plastics.
For the reverse analysis of ordinary materials, enterprise technicians usually judge by experience, such as burning with fire and biting with teeth. For some complex materials, professional experimental methods are usually needed.
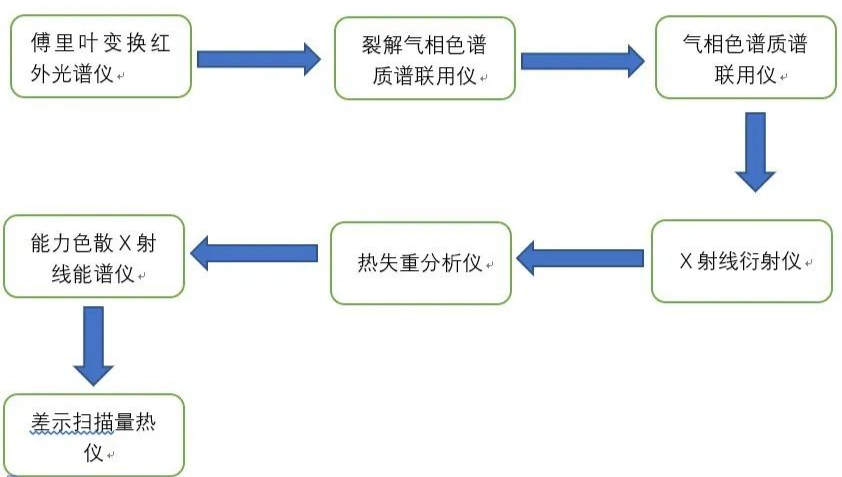
For the component analysis of complex materials, we mainly use the method of microspectrum analysis, GPC, XRD, infrared, mass spectrometry and other experiments. Through the five steps of evaluation, pretreatment, instrument analysis, spectrum library matching and reverse analysis, we can get some accurate spectrum information. This information, combined with rich development experience, can help R & D personnel restore the components of plastic formula. Today, Xiaobian arranges several experimental methods commonly used in the composition and structure analysis of modified plastics for you. You will no longer be confused when you get materials you don't know!
GPC -- molecular weight and its distribution
Basic principle:
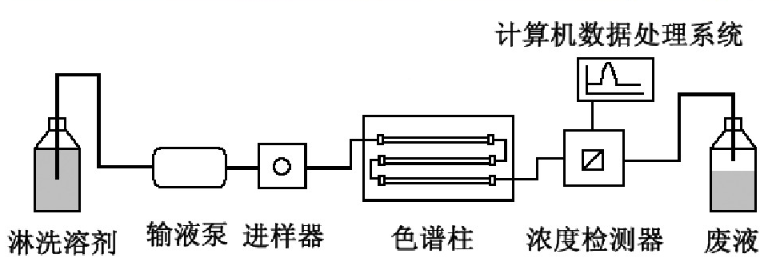
GPC is a special liquid chromatography. The instrument used is actually a high performance liquid chromatography (HPLC) instrument, which is mainly equipped with infusion pump, sample injector, chromatographic column, concentration detector and computer data processing system.
This experimental method is mainly used in the field of polymers. Organic solvents are used as mobile phases (chloroform, THF, DMF), and styrene divinylbenzene copolymer is commonly used as stationary phase filler.
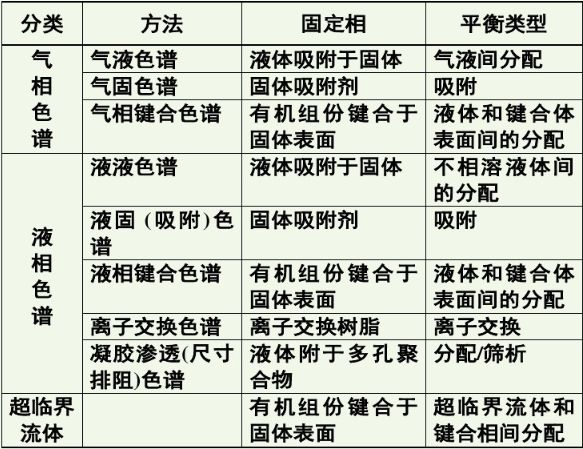
The most obvious difference between HPLC and HPLC is that the types (properties) of chromatographic columns used by them are different: HPLC is separated according to the affinity between various molecules in the separated substance and the filler in the chromatographic column, and the separation of GPC plays a major role in the volume exclusion mechanism.
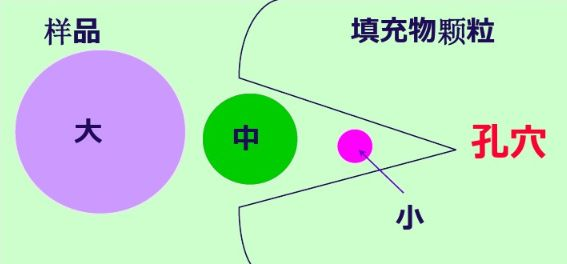
When the analyzed sample enters the chromatographic column with the mobile phase at a constant flow rate through the infusion pump, the polymer with a volume larger than the pore size of the gel cannot penetrate into the pore of the gel and is repelled. It can only flow through the gel particles and flow out of the chromatographic column first, that is, its leaching volume (or time) is the smallest; The medium volume polymer can penetrate into some large pores of the gel but cannot enter the pores. The time for the large volume polymer to flow out of the chromatographic column is later and the leaching volume is slightly larger than that of the large volume polymer; The polymer whose volume is much smaller than the size of the gel cavity can all penetrate into the gel cavity, and finally flow out of the chromatographic column with the largest leaching volume.
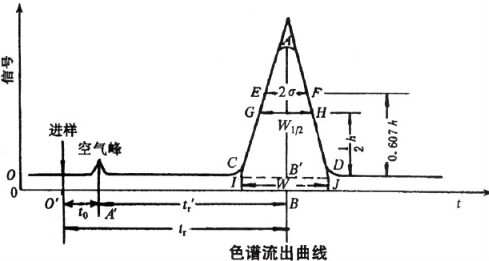
Therefore, the leaching volume of polymer is related to the volume of polymer, that is, the molecular weight. The larger the molecular weight, the smaller the leaching volume. The separated high molecular weight is continuously leached out of the chromatographic column and enters the concentration detector.
Standard sample:
Polystyrene (PS, soluble in various organic solvents);
Polymethylmethacrylate (PMMA);
Polyethylene oxide (PEO, also known as polyethylene oxide, soluble in water); Polyethylene glycol (PEG, soluble in water);
PEO and PEG have the same carbon chain skeleton, but their synthetic raw materials and end capping are different. Due to the properties of raw materials, the molecular weight and structure of their products are different. PEO often refers to polyethylene oxide with methyl terminated at one end and hydroxyl terminated at the other end, while peg is generally polyethylene glycol with hydroxyl terminated at both ends.
Eg. change of molecular weight distribution of styrene butadiene rubber during molding:
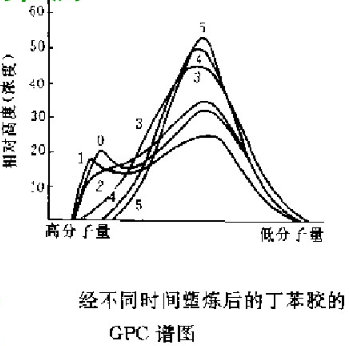
The results are shown in the figure. With the increase of time, the splitting solution of high molecular weight components increases, and the GPC curve moves to the direction of low molecular weight. After 25min, the high molecular weight components almost disappear. If the purpose of plastic refining is to eliminate this component, 25min is enough. The GPC data can help the staff determine the plastic refining time.
Infrared spectrum - functional groups, chemical composition
Basic principle:
Spectral analysis is a method to identify a substance and determine its chemical composition, structure or relative content according to its spectrum. According to the analysis principle, spectral technology is mainly divided into absorption spectrum, emission spectrum and scattering spectrum; According to the morphology of the measured position, the spectral technology mainly includes atomic spectrum and molecular spectrum. Infrared spectrum belongs to molecular spectrum, including infrared emission spectrum and infrared absorption spectrum. The commonly used is infrared absorption spectrum.
Application in polymer material research:
1) Analysis and identification of polymers
The types of polymers are complex and the spectra are complex. Different substances have different structures and corresponding spectra. Therefore, the final results can be obtained by comparing the analysis results with the standard spectra.
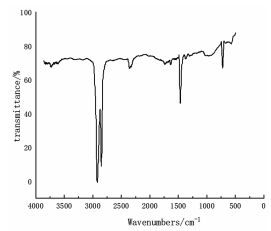
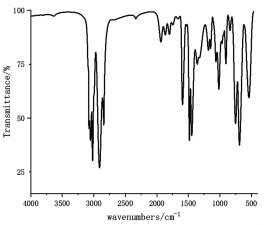
Infrared spectra of polyethylene (left) and polystyrene (right)
2) Measurement of polymer crystallinity
Because the samples of fully crystalline polymers are difficult to obtain, the absolute amount of crystallinity cannot be measured independently only by infrared absorption spectrum, and the results of other test methods need to be combined.
For example, X-ray diffraction method, density method, DSC method, nuclear magnetic resonance NMR absorption method, etc.
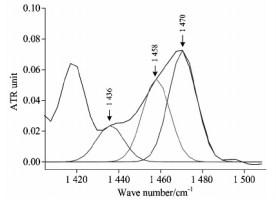
剪切振动峰值拟合
UV spectrum - identification, impurity inspection and quantitative determination
Basic principle:
When light irradiates a sample molecule or atom, the outer electron absorbs a certain wavelength of ultraviolet light and transitions from the ground state to the excited state. The UV wavelength range is 10-400 nm. The wavelength in the range of 10-200nm is called far ultraviolet, and the wavelength in the range of 200-400nm is near ultraviolet. The characterization of material structure is mainly in the UV-vis wavelength range, i.e. 200-800nm.
1) Qualitative analysis:
It is especially suitable for the identification of conjugated systems and inferring the skeleton structure of unknown substances. It can also be used for qualitative identification and structural analysis in combination with infrared spectroscopy and nuclear magnetic resonance spectroscopy. Compare the relationship between the absorption spectrum curve and the maximum absorption wavelength, and conduct qualitative test.
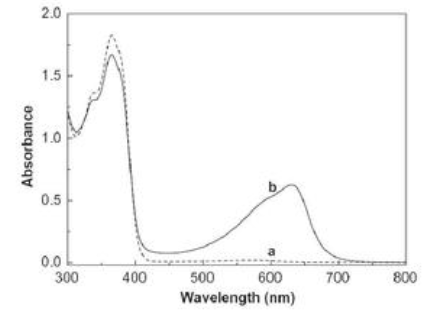
2) Quantitative analysis:
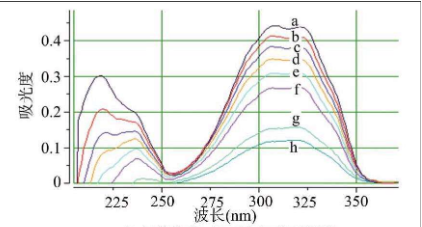
According to Lambert Beer law, there is a linear relationship between the absorbance of the measured substance at a certain wavelength and the solubility of the substance. The concentration and content of the substance in the solution are obtained by measuring the absorbance of the solution to the incident light of a certain wavelength.
Mass spectrometry test
Basic principle:
Mass spectrometry is a special technology widely used in various disciplines to identify compounds by preparing, separating and detecting gaseous ions. Mass spectrometry can provide rich structural information in one analysis. The combination of separation technology and mass spectrometry is a breakthrough in separation science. Among many analytical methods, mass spectrometry is considered to be a universal method with high specificity and sensitivity and has been widely used. Mass spectrometry is a convenient and reliable method to provide molecular weight and chemical formula of organic compounds, and it is also an important means to identify organic compounds.
After the sample is gasified, the gas molecules enter the ionization chamber. One end of the ionization chamber is equipped with a cathode filament, which generates an electron beam after being energized. Under the impact of electron beam, molecules lose electrons, dissociate into ions and are further broken into charged fragment ions with different mass numbers. Such ion source is the most commonly used in mass spectrometer, which is called "electron bombardment ion source".
Application in polymer materials:
1. Analysis of monomers, intermediates and additives of polymer materials.
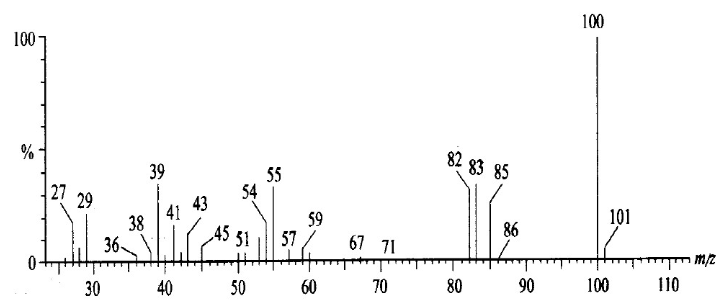
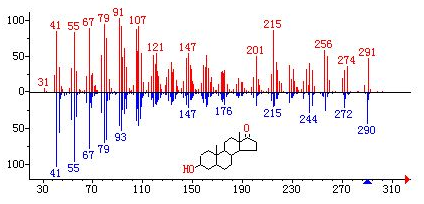
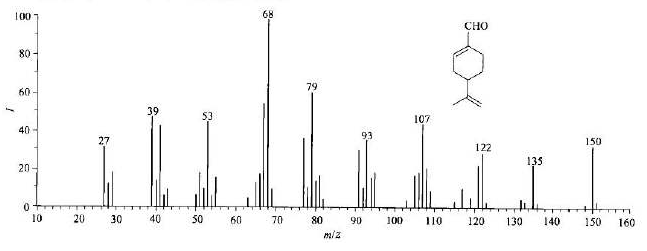
As shown in the mass spectrum diagram below, it can be determined that the unknown molecule contains one carboxyl group and one methyl group, and the rest can only be - CO2 or - c3h4. But the latter is more likely.
2. Characterization of polymer.
Each polymer compound has different molecular formula and molecular structure. The mass spectrum is like the "ID card" of polymer materials. According to its mass spectrum, which kind of polymer material can be determined.
X-ray diffraction (XRD) -- Determination of polymer crystallization properties
Basic principle:
X-ray is an electromagnetic radiation with a very short wavelength (about 10-8 ~ 10-12 meters) between ultraviolet and gamma rays. It was discovered by German physicist roentgen in 1895. X-ray can penetrate a certain thickness of material, and can make fluorescent substances glow, photographic latex photosensitive and gas ionization.
Application of XRD:
This time, we will focus on the application or calculation of XRD in polymer crystallinity.
There are four formulas for calculating the crystallinity of natural cellulose:
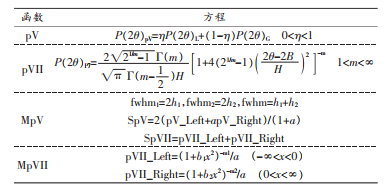
It can be seen from the figure below that the half peak width of the four diffraction crystal planes of natural cellulose is large, the coincidence degree of diffraction peaks is high, and the coincidence degree of crystalline phase and amorphous phase is large, which makes it difficult to locate the amorphous peak.
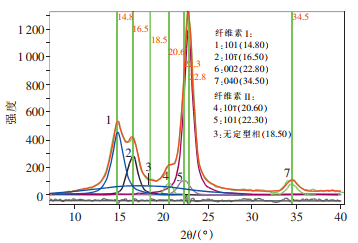
XRD pattern of natural cellulose
Small angle X-ray scattering (SAXS) -- arrangement of crystals in atomic size
Basic principle:
The atoms in the crystal are forced to vibrate under the action of x-rays emitted into the crystal, forming a new X-ray source and emitting secondary X-rays.
If the irradiated sample has aperiodic structures with different electron densities, the secondary X-ray will not interfere, which is called diffuse X-ray diffraction. X-ray scattering needs to be measured in a small angle range, so it is also called small angle X-ray scattering.
Sample preparation requirements:
① Block sample: the block sample is too thick for the light beam to pass through, so it must be thinned;
② Thin film sample: if the thickness of the thin film sample is not enough, several identical samples can be stacked together for testing;
③ Powder sample: the powder sample shall be ground to have no sense of particles. During the test, it shall be wrapped with very thin aluminum foil (carrier), or the powder shall be evenly stirred in collodion to make a flake sample with appropriate thickness;
④ Fiber sample: for fiber sample, it shall be cut as much as possible and prepared as powder sample;
⑤ Granular sample: it is troublesome for coarse granular samples that cannot be ground. One method is to cut the particles into thin sheets of the same thickness as possible, and then lay them neatly on the tape; Another method is to melt or dissolve the particles to make a flake sample, but on the premise that the original structure of the sample cannot be damaged;
⑥ Liquid sample: the solution sample must be injected into the capillary for testing. When preparing the solution, pay attention to: 1. The solute is completely dissolved in the solvent, that is, there is no precipitation. 2. The electron density difference between solute and solvent should be as large as possible.
Application in polymer materials:
In natural and synthetic polymers, small angle X-ray scattering generally exists, and has many different characteristics. The application of small angle X-ray scattering in polymers mainly includes the following aspects:
① The shape, particle size and particle size distribution of colloidal particles in polymer glue were determined by Guinier scattering;
② The grain in crystalline polymer, the micro region in blend polymer (including dispersed phase and continuous phase), the shape, size and distribution of voids and cracks in polymer were studied by Guinier scattering;
③ The orientation, thickness, crystallization percentage and thickness of amorphous layer in polymer system were studied by long-term measurement;
④ Molecular motion and phase transition in polymer system;
⑤ The correlation length, interfacial layer thickness and total surface area of polymer multiphase system were studied by Porod Debye correlation function method;
⑥ The molecular weight of high molecular weight was measured by absolute strength measurement.
According to the experience of the small editor, there will be some deviation in the test results of the repeated test institutions. There are often more than ten or even twenty different components in the common TPE and TPV formulas. Taking PP as an example, PP alone can be divided into homopolymerization and copolymerization, and copolymerization can be divided into random and block. The same kind of random copolymerized PP also has different molecular weight and melt index. In addition, the graft copolymer can generally be measured because of its low grafting rate. Although they are all PP, the materials made of PP of different brands from different manufacturers will be very different. In addition, the diversity of materials will produce different interference to infrared analysis, thermogravimetric analysis and other analysis, and various interference sources will also be produced by the reaction and decomposition in the process of material processing.
Therefore, component analysis can only be an auxiliary means in material development, which can help you determine which components and approximate proportions are included in some materials. However, truly efficient materials still need to be continuously adjusted and developed based on a large number of experiments.

 Wechat scanning communication